Advantages
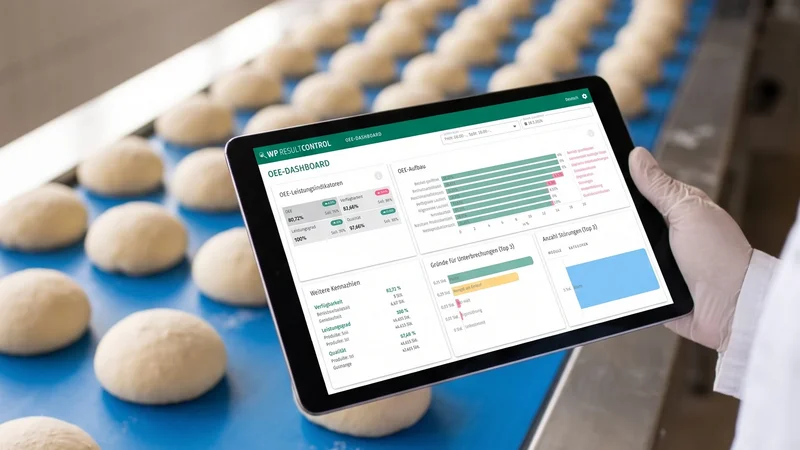
WP RESULTCONTROL makes your production performance measurable—with a clear OEE dashboard that consolidates all relevant metrics for your equipment in real time. Downtime, malfunctions, and deviations are automatically detected and analyzed. This allows you to make decisions based on actual data rather than assumptions.


 AI-generated illustration The illustrations were created in cooperation between humans and artificial intelligence. They show a future in which technology is omnipresent, but people remain at the center.
Keep an Eye onProductivity at All Times
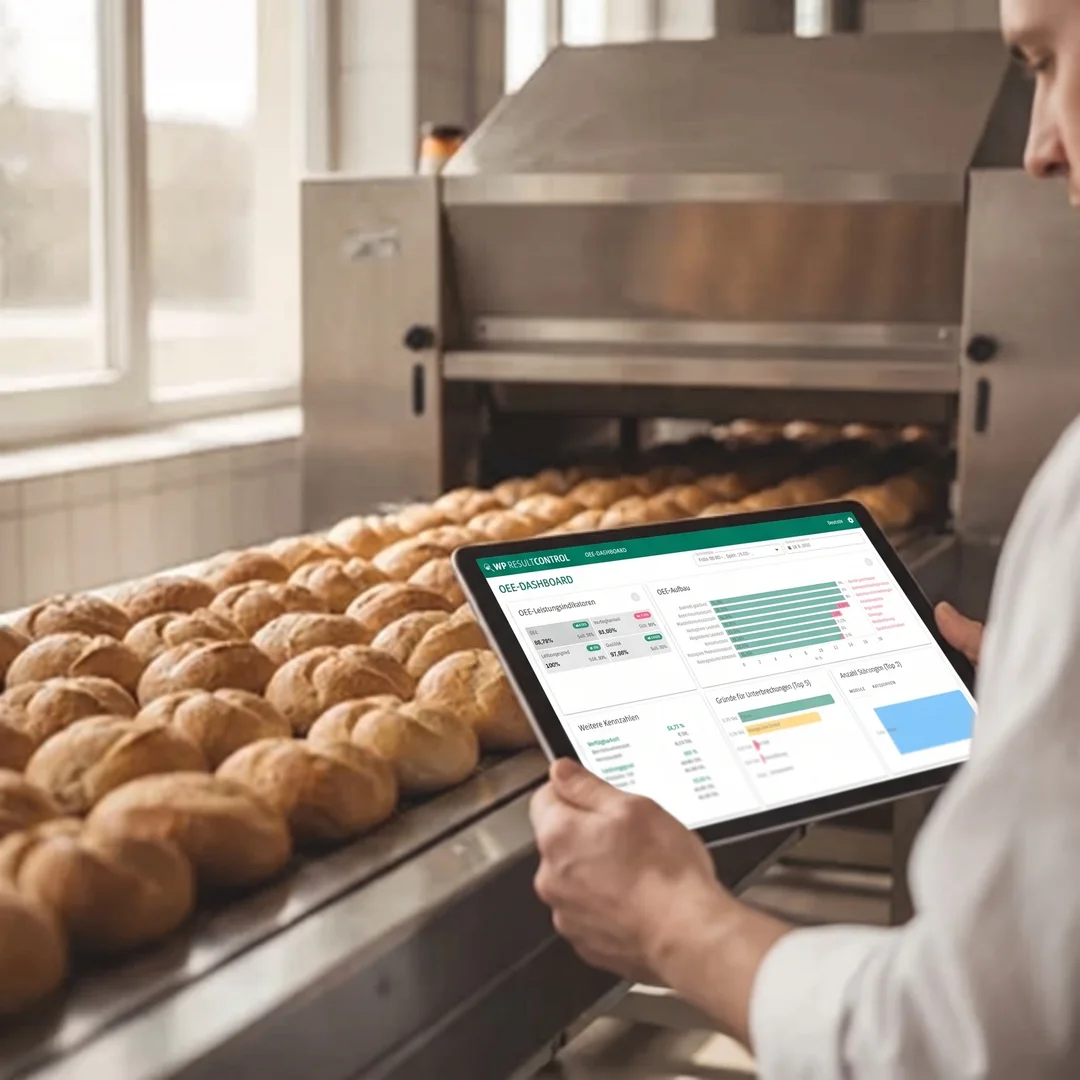
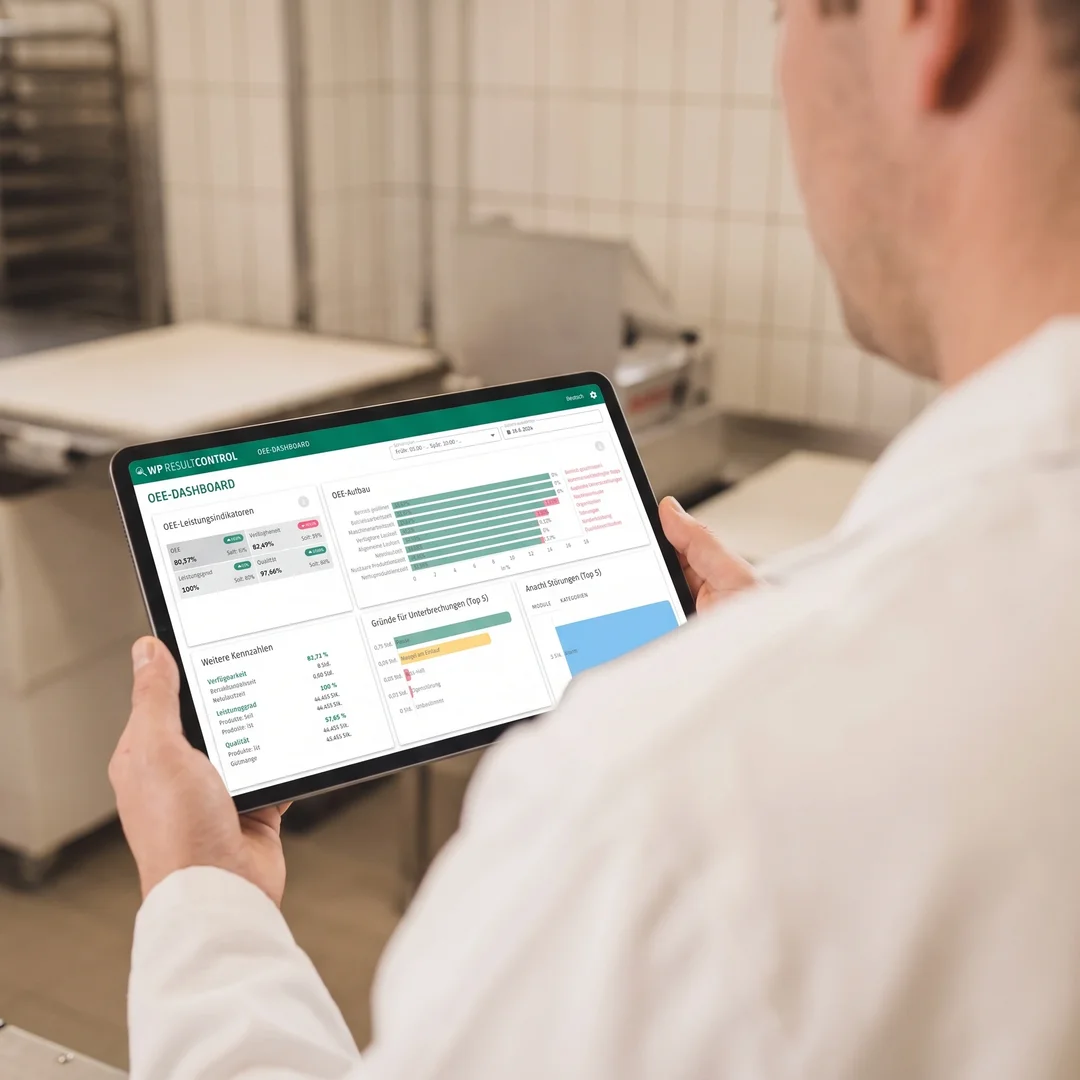
All key metrics are clearly displayed on the OEE dashboard.
The easy-to-navigate OEE dashboard displays all relevant performance metrics for your equipment in a clear layout. Color-coded deviations make problems immediately visible. This allows you to see at a glance whether your production is on target or if action is needed.
 AI-generated illustration The illustrations were created in cooperation between humans and artificial intelligence. They show a future in which technology is omnipresent, but people remain at the center.
DetectDowntime Faster
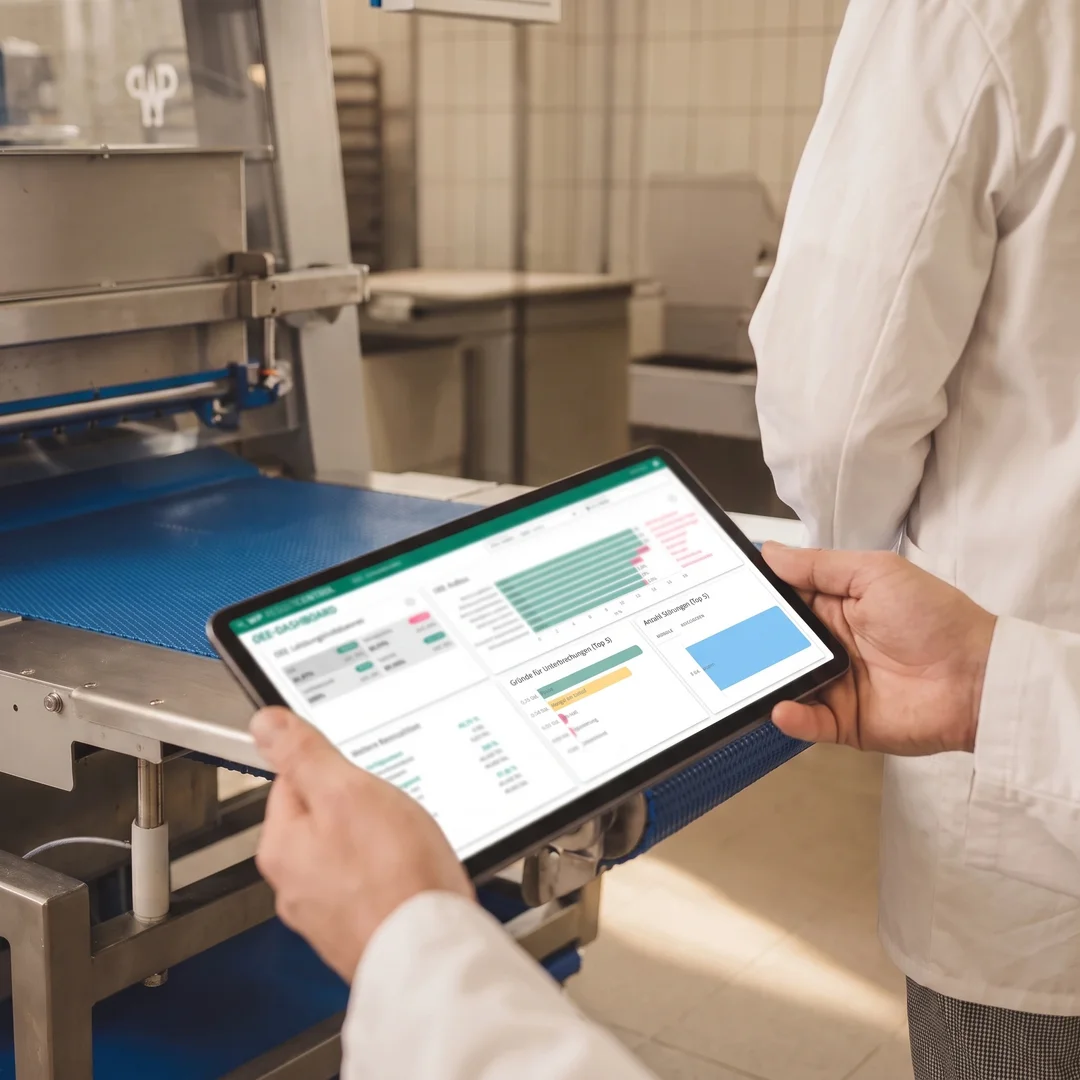
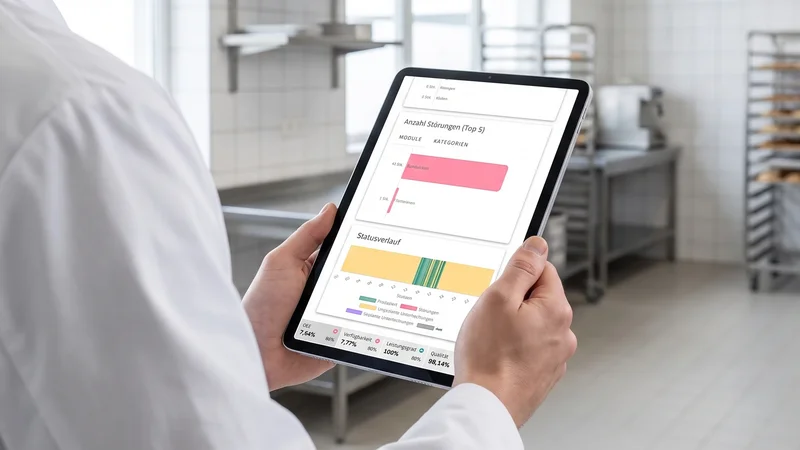
Common causes of malfunctions and failures are automatically analyzed.
The software automatically analyzes malfunctions and downtime and shows you the most common causes. This means you no longer have to spend a long time searching for the source of the problem. You can focus your efforts precisely on the areas where performance is actually being lost.
 AI-generated illustration The illustrations were created in cooperation between humans and artificial intelligence. They show a future in which technology is omnipresent, but people remain at the center.
Making Informed Decisions
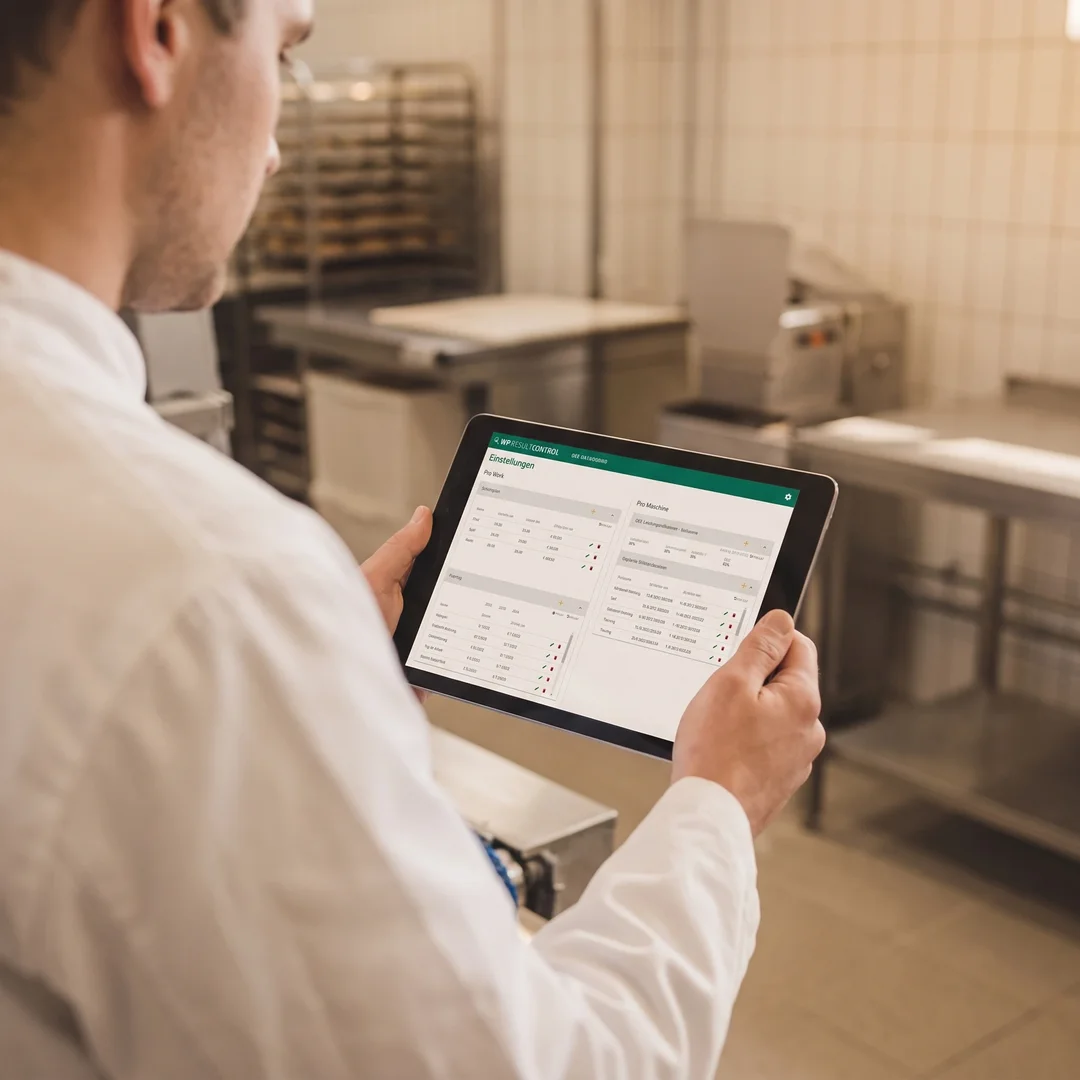
Clear analyses help you implement targeted measures to improve performance.
With clear metrics and easy-to-understand analyses, you can establish an objective basis for decision-making. Instead of relying on guesswork, you can act based on actual production data. This increases planning reliability and improves your results in the long term.
 AI-generated illustration The illustrations were created in cooperation between humans and artificial intelligence. They show a future in which technology is omnipresent, but people remain at the center.
Flexible Reports for Your Daily Work
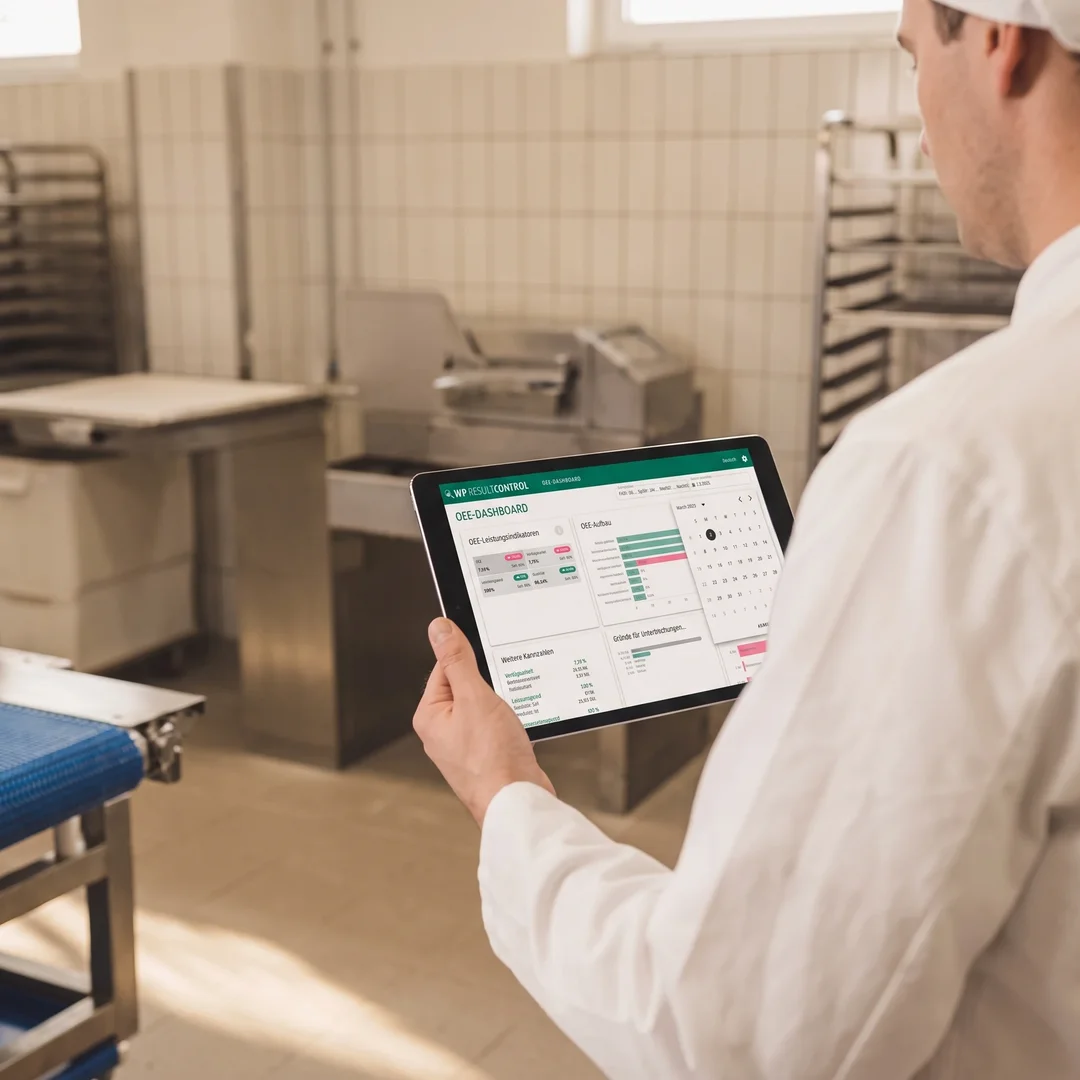
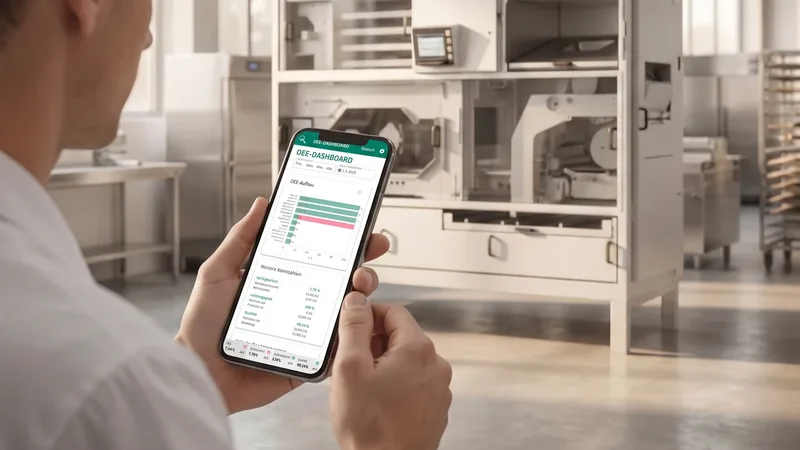
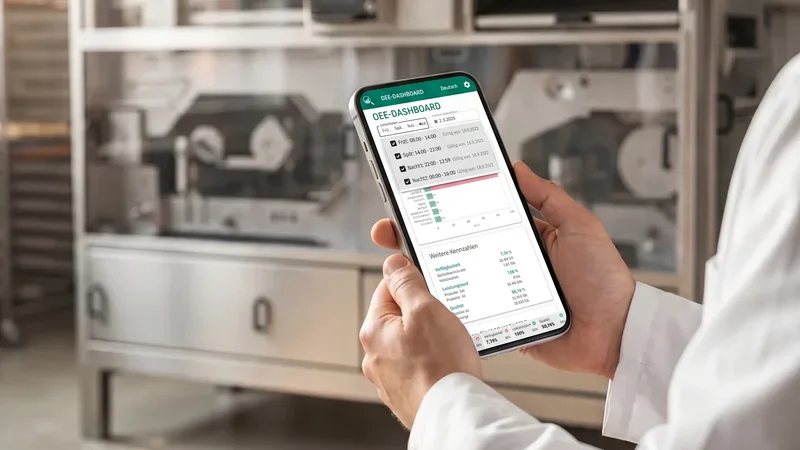
Key metrics can be analyzed by shift, day, week, or month.
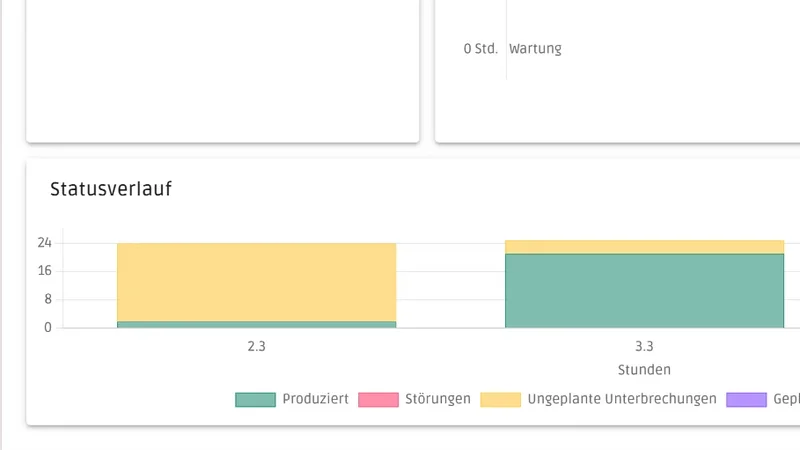
Whether it's a single shift, a full day, or an entire month—you choose the time period that's relevant for your analysis. Graphs make trends and changes immediately visible. This allows you to identify developments early on and take corrective action.
 AI-generated illustration The illustrations were created in cooperation between humans and artificial intelligence. They show a future in which technology is omnipresent, but people remain at the center.
Reliable data directly from the machine
A standardized interface ensures precise and automatic data collection.
Thanks to the standardized machine interface, production data is automatically collected and analyzed. This eliminates the need for manual record-keeping and reduces sources of error. You’ll always have access to accurate, up-to-date information about your plant.
Data-Driven Manufacturing
WP RESULTCONTROL uses the Weihenstephan Standard for machine connectivity—a proven, cross-vendor interface for the automatic collection of production data. For you, this means: no manual record-keeping, no data silos, and no sources of error. All key metrics flow directly and reliably from your machines into the system—ensuring a solid, up-to-date data foundation that serves as the basis for every analysis.

Features of WP RESULTCONTROL – Spare Parts Management of the Future
- Display of all relevant OEE productivity metrics
- Deviations highlighted in color
- View by day, week, or month
- Overview of downtime causes and malfunctions.
- Graphical analyses for freely selectable time periods
- Analysis by shift, day, week, or month
- Quick identification of trends and deviations
- Automatic Classification of Malfunctions
- Display of the Most Common Causes of Downtime
- Sorting by Categories and Modules
- Detailed analysis of downtime
- Data Collection Using the Weihenstephan Standard
- Automatic transmission of production data
- Reliable and consistent data foundation

Bitte einen Punkt auswählen
Use Cases – How to Use WP RESULTCONTROL
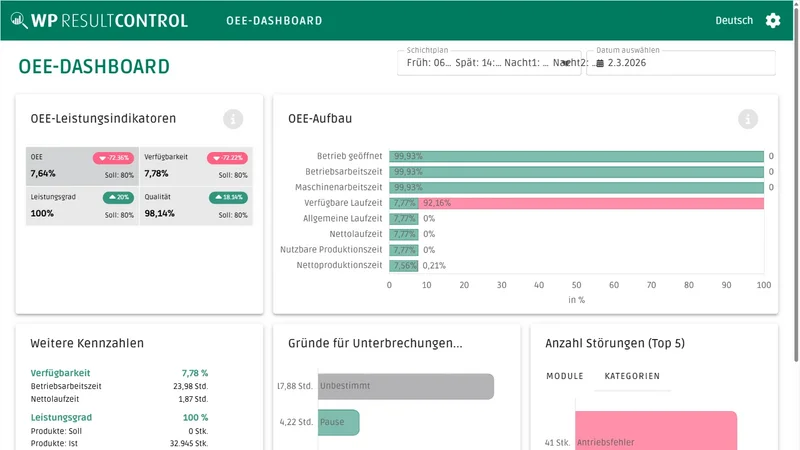
Open the OEE dashboard to immediately view all key performance metrics for your equipment. Color-coded indicators show you at a glance where deviations are occurring and where you should take action.
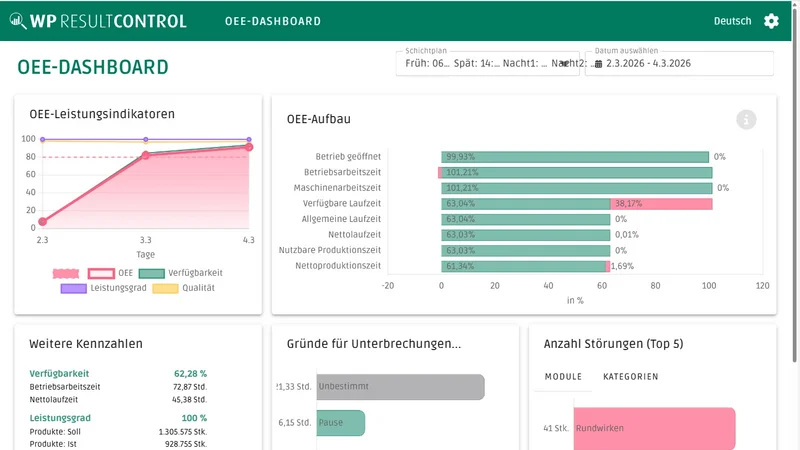
Compare productivity figures over days, weeks, or months. This allows you to identify trends early on and take targeted steps to improve performance.
Get a clear overview of the most common malfunctions and causes of downtime. This allows you to identify bottlenecks more quickly and take targeted action to address them.
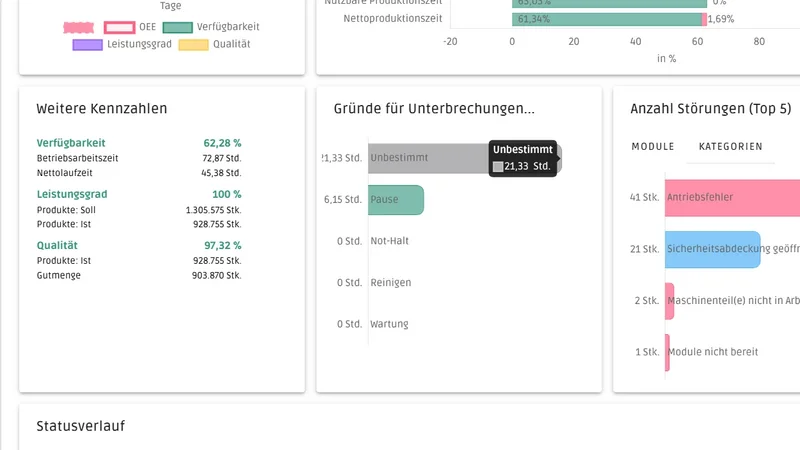
Analyze the status history for a given day and see exactly when and why problems occurred. This allows you to implement targeted solutions and continuously improve your processes.
Bitte einen Punkt auswählen